| Version Compatibility Module Name | Uptime Monitoring Station Version |
|---|---|
| Incident Console Dashboard 1.2 | 7.2 Windows/Linux |
| Incident Console Dashboard 1.1 | 7.1 Windows |
| Download Files |
|---|
| Information Table | |
|---|---|
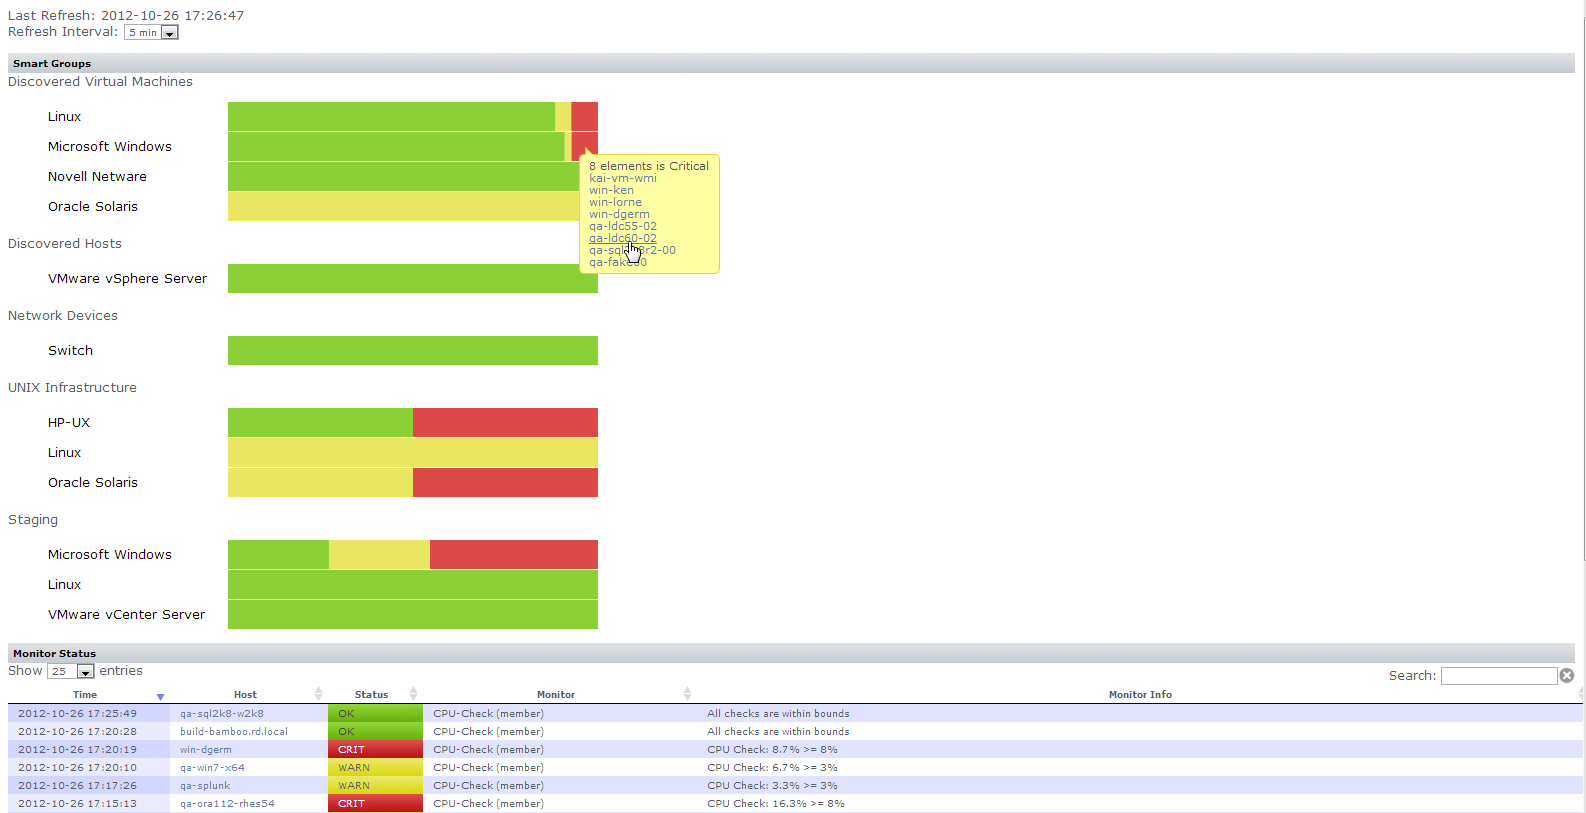
| Description: | This dashboard allows users to visualize how many elements are current in the various states. Features include:
|
| Supported Monitoring Stations: | 7.2 Windows/Linux, 7.1 Windows |
| Supported Agents: | None; no agent required |
| Installation Notes: | Install using the Uptime Plugin Manager The Uptime Controller is needed for this dashboard. Please read this example on how to configure it. After the Plugin Manager finishes installing the dashboard, execute the following steps to add a tab in Uptime:
[Uptime_root_dir]/GUI/incidentConsole/lib/main.js
http://[Uptime_host]:[Uptime_port]/incidentConsole
myportal.custom.tab2.enabled=true myportal.custom.tab2.name=Incidents myportal.custom.tab2.URL=/incidentConsole/ Depending on how many custom tabs you already have in My Portal, you might need to change “tab2” to an appropriate value.
Note: IE sometimes goes into quirks mode which cause the dashboard to fail. Either force IE to disable quirks mode or use another browser such as Google Chrome. |
| Dependencies: | PHP libCurl, Uptime Controller |
| Languages Used: |
|
Notes:
Sample screen shot