Welcome to the Grid, your source for Uptime Infrastructure Monitor plug-ins, enhancements and other custom modifications. This site is monitored and moderated by the IDERA team and supported by the Uptime Infrastructure Monitor user community. We're excited to have you participate and we look forward to featuring some of the great plug-in monitors and enhancements created by our clients. Get the most out of Uptime Infrastructure Monitor, plug in to the Grid!
There are currently 83 plugins.
Categories: plugin (61) mod (3) dashboard (3) gadget (15) manager (1)
Checks whether an SSL certificate is going to expire (checks the number of days remaining and lets you set an alert threshold).
This advanced HTTP(with SNI) monitor is made to handle any type of web service / SOAP / HTTP interfaces. You can customize the HTTP header as well as the body of the (POST) request.
Rotates through all the desired Uptime dashboard pages automatically.
This plugin monitors the performance of Microsoft Exchange 2013. This is only supported on a Windows Monitoring Station. An agent is not required.
The Capacity Planning What-If gadget allows you to analyze the available capacity of monitored sytems based on common performance metrics and a set of user-defined assumptions.
The Capacity Planning gadget allows you to assess the available capacity of monitored sytems based on common performance metrics.
The Enhanced Advanced All Services Gadget.
This plug-in monitor is designed for use with the Uptime monitoring station and Windows, Linux, Solaris or AIX version 5+ agents. It scans for certain log files on the agent system and searches the files for a specified string (regex compatible).
Checks a https protected url for time till the SSL certificates will expire.
This plugin monitors the performance of SharePoint 2013. This is only supported on a Windows Monitoring Station. An agent is not required.
Scan AIX Errpt Logs for Errors
Check the status of multiple windows services via a variety of filters
Monitor Oracle Tablespace Capacity Metrics
Monitor fiber channel path availability on Unix (AIX) servers
Query an Oracle database and return the results to Uptime
EMC VNX Capacity Metrics broken down by Raid Group
EMC VNX Capacity Metrics broken down by Raid Group
Query a SQLServer database and return the results to Uptime
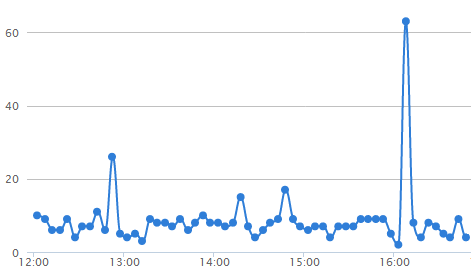
The Metric Chart gadget makes it possible to graph metrics collected by Uptime in just a few clicks. You can now finally visualize those important metrics on your custom dashboard in the form of beautiful line or area graphs!
The Resource Scan gadget allows you to easily display the Resourescan gadget for an element group in your own custom dashboards
The Quick Snapshot gadget allows you to easily display an Elements quicksnapshot view in your custom dashboards
Monitor any SNMP OID on any type of element(Agent, WMI, Virtual Node etc). Also allows you to monitor OIDs directly without the associated MIB files.
This monitor uses CIM to collect the statuses and metrics of various components of an IBM SAN, such as backend controller, node and storage pool.
Monitor status and lags of NetApp SnapMirror.
This plugin remotely executes a command through SSH and monitors the string/numeric output, exit code and response time.
This plugin monitors an LPAR's physical processor consumed and entitled capacity consumed.
This plugin monitors the performance of SharePoint. This is only supported on a Windows Monitoring Station.
Scan a log/text file. Mainly used for system log (Linux/UNIX syslog) but can be used for any log/text file.
Monitors Solaris Zone workload metrics such as CPU, Memory, RSS Memory and Number of Processes Running.
Monitor the availability of a MySQL Replication Status.
The Custom Remote Integer allows you to run agent side scripts and pull the output into Uptime as an integer value.
Monitor the availability of a Postgres database.
The Custom Remote Monitor will trigger a script on a remote system via the Uptime agent and return the output to uptime as a string.
The Apache module mod_security allows us to apply a security layer on top of Apache without making any uptime core changes. It can protect Apache from various different security vulnerabilities and attacks, such as XSS (Cross Site Scripting) attacks.
This advanced HTTP monitor is made to handle any type of web service / SOAP / HTTP interfaces. You can customize the HTTP header as well as the body of the (POST) request.
Monitor and login to websites with Windows authentication (NTLM), such as SharePoint & Exchange.
Monitor JBoss AS 5 and 6 performance metrics.
This plugin connects to a Solaris client and reports on ZFS pool capacity, read/write operations and bandwidth.
This plugin connects to a Solaris client and reports on calls, badcalls, retrans, badxids, timeouts, newcreds and nulls.
Launches an ICO session to test connectivity. If successful, gathers XenApp metrics.
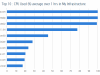
The Top Resources gadget displays the top resource offenders of the metric of your choice. Many options are available, such as how many elements to show, whether to show top or bottom elements and average/min/max over various periods of time.
This plugin will connect to your AWS account and auto-discover instance to a defined group. As new instances are discovered to this group, an availability and performance service monitor is associated with each instance.
Given an Amazon AWS access and secret key, this plugin obtains performance metrics for an instance if it is running.
This plugin uses the XenServer Management API and XAPI RRD to gather performance and health metrics for XenServer.
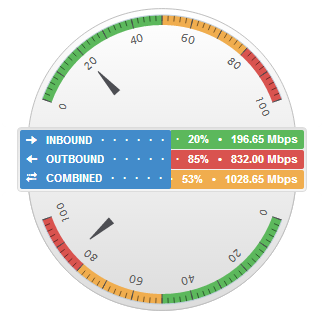
Display port-level network performance metrics in a convenient visual gauge format.
Plug-in monitors allow you to extend the Uptime platform to get the additional metrics you need to achieve full spectrum monitoring of your disparate environments.
This dashboard allows users to visualize how many elements are current in the various states.
This solution will convert the database tables to partitioned tables for better performance and improved data management.
Monitors ZPool errors and, if any are found, will display info on which disks are affecting the ZPool.
Monitor for Websphere MQ 7.x
This monitor allows users to threshold VMware ESX datastore target capacities.
Easily view the health of your infrastructure's core topology using this interactive topology gadget. View the entire topology or pick and choose which segments to focus on.
Monitor the number of performance data sample that the Uptime Monitoring Station stored in the database.
Monitor internal queues in the Uptime Monitoring Station core.
Create your own customized status view of IT service, application, geography, topology, workflows or anything else you can dream up. Use a custom image as your background and place pins to indicate status.
Mobile dashboard which allows administrators to access the Uptime UI from a mobile device.
The incident panel provides up to the second details on current outages in your environment so that you can quickly triage and respond to incidents.
Use this gadget to display the element or service monitor status in a pie or bar gadget format for a group of elements.
Use this gadget to display the service monitor status in a pie or bar gadget format for a single element.
Display detailed availability information for a single element including topological parents status and service monitor status.
Drag and drop map editor for Uptime elements.
Provides same functionality as the built-in SQL Basic monitor but stores the query results in a numeric result for thresholding or comparison.
Collection of scripts to be used with Trap Receiver to integrate SNMP traps into Uptime. Please refer to the knowledge base article Integrate SNMP Traps Into Uptime for more information.
Allows alerts to be acknowledged remotely from an alert email via a quick web page (login not required). It acknowledges the alert using the built-in API.
gadget real-time data in a dashboard.
Monitor for NetApp filer (SAN) metrics.
Uses WMI via VBSCRIPT on the host to check for system uptime
This plugin monitors the performance of SharePoint 2010 and newer. This is only supported on a Windows Monitoring Station.
Monitor CPU/Memory performance on an IBM (iSeries) AS/400 server.
This monitor enables users to define monitoring for any JMX MBeans.
The File System Capacity Logical Disk Monitor will return the used space for each of the drives listed in the LogicalDisk performance counter as a percent value on Windows system.
This plug-in can report on changes in a directory by many attributes.
This mod adds more variables to alert profiles. The variables are listed below.
This monitor monitors various tablespace metrics for DB2.
This monitor monitors various buffer pool metrics for DB2.
This monitor performs availability checks on DB2 databases by executing a query. User can set threshold on the resulting string.
This mod will convert the database tables to partitioned tables for better performance and improved data management as well as automated archiving/deletion.
Monitor Cisco Router CPU and Memory. This can be done Uptime 7+ with the built-in SNMP Poller monitor.
Monitors Apache Tomcat via the performance console.
Retrieves the MOD-STATUS from Apache into monitored metrics.
This plugin monitors various health & performance metrics for AIX WPAR's.
This plugin gathers CPU utilization across all LPAR's for a given pSeries server. The data collection is synchronized to ensure the stacked data points are accurate.
Customize the Posix (Linux, Solaris, AIX, HP-UX) Uptime agents to display more info on each java process and easily distinguish between them.